I had the pleasure of recording an episode of the Mob Mentality podcast with the energizing and fun Austin Chadwick and Chris Lucian. They do so much for the Agile community on the micro and macro level. We discussed some simulation tools, and the value of doing “Advanced Napkin Math” in cases where we don’t know exact numbers, but we can leverage heuristics.
We’ve got somewhere close to 120 years of Operations Management science to rely on. Work patterns, repeatability, specialization, hierarchy, management, measurement, statistical process control, visual planning, quality management, ANOVA statical analysis, multiple linear regression, computer simulation and much more.

One resource mentioned is Michel Grootjan’s online simulator, and his GitHub code. You can download and run his project, or follow his instructions for a few comparison changes to a base team, using his online version. To leverage this tool with your team, I recommend using Excel to keep track of the number of each member skill, the total cost of the team, the input work time ratios for the simulation, and the output in Throughput, Cycle Time, Max WIP, and even resource utilization. Be sure to calculate the cost of any changes you make. For instance, WIP throttling, cross-skilling, or cutting batch size are free. Adding people in skill areas costs money. You can write some simple formulas to calculate the increase in throughput and decrease in cycle time vs. the cost to achieve these outputs. Be sure to compare the throughput increase that can be achieved by combining the free effects, vs. the increase in throughput and the budget cost of achieving it through brute force (labor).
Michel Grootjans – Explaining Flow
https://github.com/michelgrootjans/explaining-flow
You can also try Featureban 3.0
https://tools.kaiten.io/featureban/a7cd5d30-1145-487b-8979-fc6bd5a3248c
Twig – The WIP Game
https://analytics.actionableagile.com/twig/index.html
And Kanbanize
https://kanbanize.com/simulation

Another question is “What sciences work for Factory Production only, what works for both Factories and Custom Software Development, and what unique techniques are available only in Custom Software Development?”
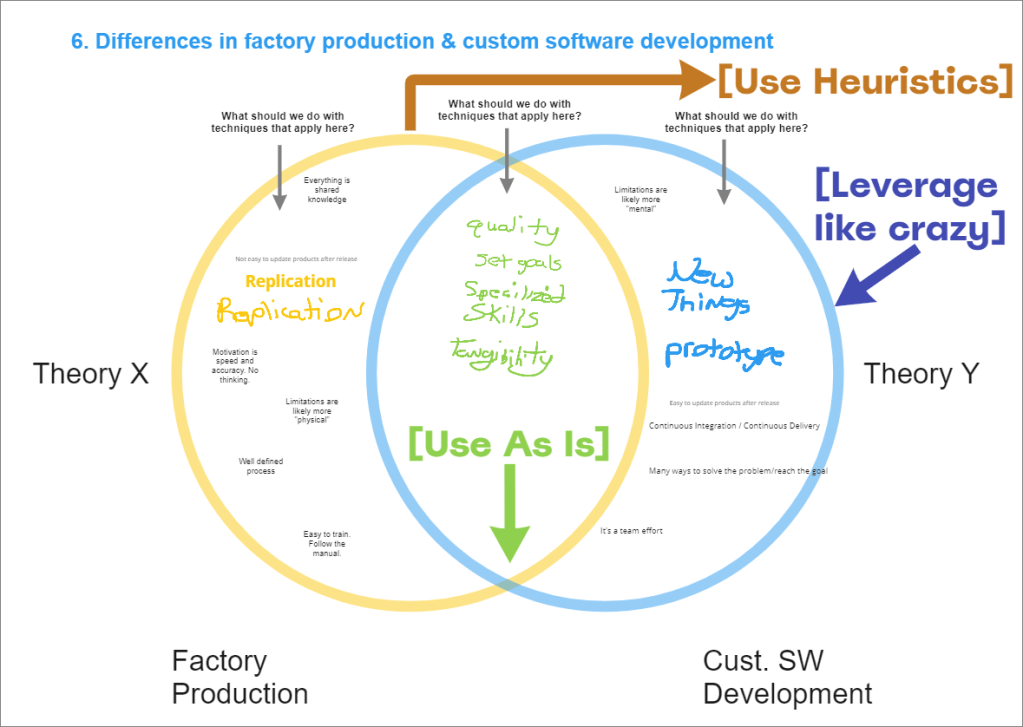
When a technique works for both, use it as is. When a technique only applies in a highly regimented and predictable factory environment, don’t throw the baby out with the bathwater. Use the heuristics even if you don’t know exact numbers. If you can estimate two or three items, use heuristics with your estimate numbers. You can construct Expected Value trees and use the probable outcome values. And of course, those techniques that are peculiar to software — leverage the heck out of them.

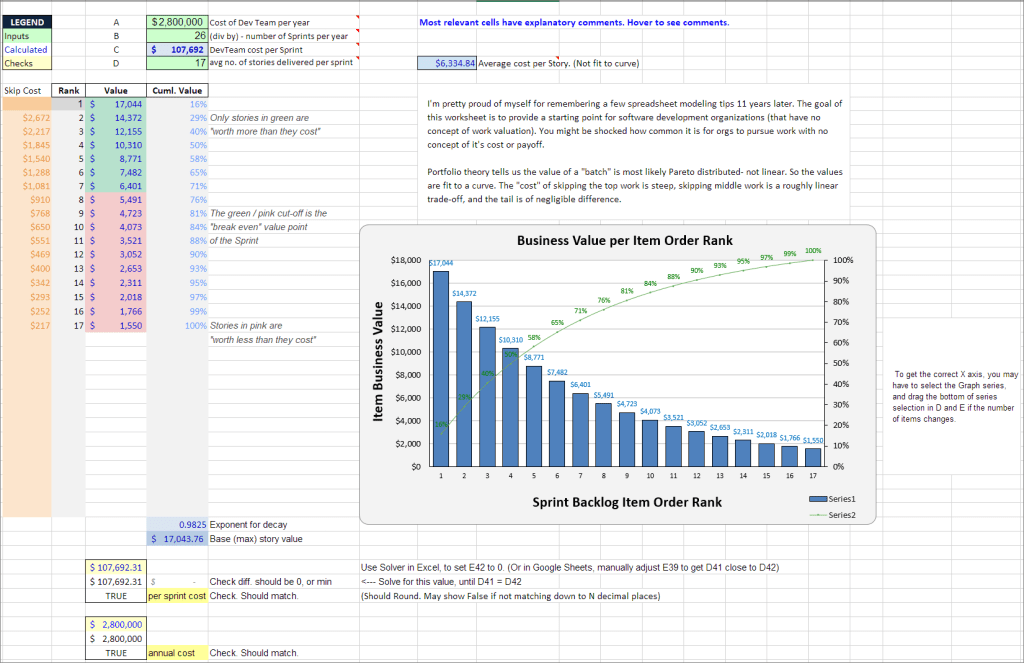
This is a model explaining the real cost in dollars of various techniques to order to Product Backlog. You can read the full article here. The primary point of this exercise is that Agile Portfolio Theory seeks to maximize the Value of the team by maximizing the Value of the flow of all product items. To make the case, I use absurd numbers in this spreadsheet; the values within each portfolio are increasing in orders of magnitude, and within each portfolio they all begin with the same digit. Does this matter? No it does not. The mathematical outcome is the same, even if the differences were dollars or pennies, and the numbers were more realistic. You could divide all these numbers by 100 and the graph would look the same.
The take-away is that pulling PBIs blindly from a black bag would produce a cumulative average value of a random-walk. Choosing by most Valuable portfolio is a better outcome, moving more completed value earlier in time. But the Global Optima outcome is ignoring the human conception of “portfolios” and pursuing the work at the most granular possible level, ordered by each individual value. The difference between the green and blue Value lines can be seen as the dark red line at the bottom. That’s how much money we’re losing immediately after we complete the first item, and it the entire length of the project to catch up. Accurate numbers with decimal points down to the penny don’t make this concept any more or less true. But using dollars helps to teach a concept, and cement the idea with a Product Owner, business manager, and the Developers on the team.
Another example we discussed, the Story Value Model. Does every Sprint produce the exact same amount of Value? Of course not. But, does your team measure the value of your software — at all? If not, don’t throw up your hands and say “We don’t know, so let’s just don’t use dollars for anything”. This model uses Excel Solver to calculate a proxy distribution of PBI values. Plug in the cost of operating your team for the year, we can assume the software you produce is worth at least one penny more than that. Enter the number of Sprints per year, and average number of items the team completes each Sprint. You can fiddle with the decomposition rate, but it’s not really important. We’re using universal assumptions here; #1 almost everything decomposes along Pareto curves, and #2 the Product Owner orders the PBL by value.
The outputs are the proxy numbers of dollar denominated value each story is worth. Bob likes to pick up stories with the cool new technology he wants to play with. What is that costing the team; the organization? We’ve had training and Retrospective discussion many times about skipping the items as ordered in the Sprint Backlog. But having dollars figures to look at gives us more productive conversations, like, “If we skip PBIs 1 through 3 so you can start working on number 4, we’re lighting $43,000 on fire so you can play with Elixir. Is that our goal?”

“Only posers burn Value, Bob!”
You can work with your Product Owner to build up a spreadsheet as a PBI Valuation library. Whenever you calculate the Value of a piece of software, add the model to the library. If you can get every PBI down to Net Present Value, Cost of Delay, you’ll be maximizing value.

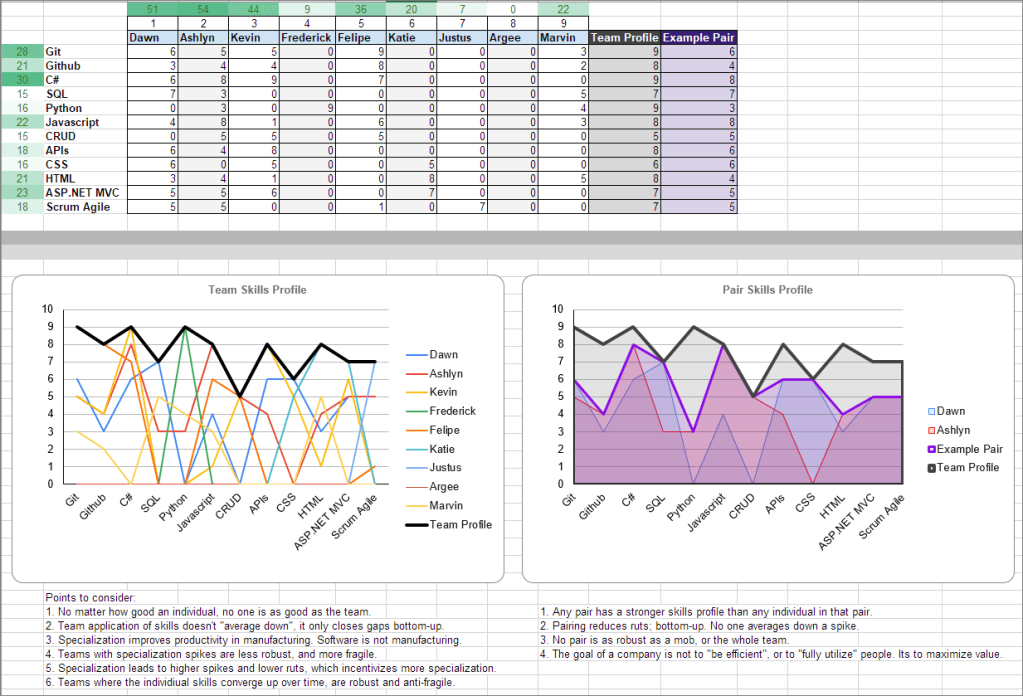
One last example, the Teak Skills Profile model. Can we accurately quantify the exact level of Steve’s SQL skills on a scale from 0 to 10? No. Do we care? We do not.
The value of the Team Skills Profile is showing that every team has a unique fingerprint. No individual, pair, or sub-group brings the same top line Skills Profile as the entire team. None of us is as good as all of us. Alarmingly, leveraging the best skills of members within your team actually makes the team more fragile, and increases the chances you will make more fragility-inducing decisions in the future.